


Statistics Canada has released a report showing the first quarter of 2023 has been a tough time for Canadian households. With rising costs of living, declining real estate values, and increasing interest rates, many households, particularly those with lower incomes and less wealth, are feeling the pinch.
Key Report Takeaways:
- Most Canadian households are dealing with reduced disposable income due to slow wage growth, inflation pressures and increasing interest rates
- The gap between the richest and poorest Canadian households is widening faster than ever before as debt-to-income ratios worsen for all but the wealthiest households
- Older Canadians who rely on their pensions are dealing with higher debt-to-income levels that are well above their 10 year levels, even though levels have improved since 2022
Income Growth is Flat
The economic news from Statistics Canada paints a stark picture, especially for those Canadians in the bottom half of income levels whose average wages and salaries grew at a relatively slow pace of just 1.0% in the first quarter of 2023, compared to 4.0% for all households. This slow wage growth, coupled with inflationary pressures and increasing interest rates, has negatively impacted disposable income for these households.
Moreover, the report reveals the number of low income earners who relied mostly on government benefits increased from 34.2% to 38.8% in just over a year. According to Statistics Canada, this increase underscores the financial weakness of these households in the current economic climate.
Debt Levels are Growing
The report also highlights the increasing burden of debt for Canadians.
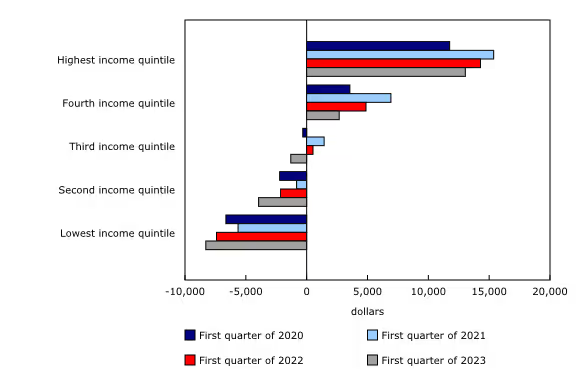
For each household group except the highest income earners, net saving in the first quarter dropped below levels recorded three years ago, at the start of the pandemic. Middle-income earners were hit hardest by inflationary pressures over the last year, spending an average of $1,306 more than they earned in income in the first quarter.
The Widening Wealth Gap
The wealth gap between the most and least wealthy households increased by 1.1 percentage points in the first quarter of 2023, marking the fastest increase on record for these estimates, which date back to 2010. This widening wealth gap underscores the growing financial differences in Canada.
Debt to Income Ratios Increase For Most Canadians
Debt-to-income ratios for younger and core working-age groups as of the first quarter were at their highest rates on record, which go back to 2010, and well above rates that had existed just before the start of the COVID-19 pandemic at the end of 2019. According to the report, only senior households (aged 65 years and older) had a debt-to-income ratio that was lower in the first quarter of 2023 (71.2%) than at the start of the pandemic in the first quarter of 2020 (71.7%).
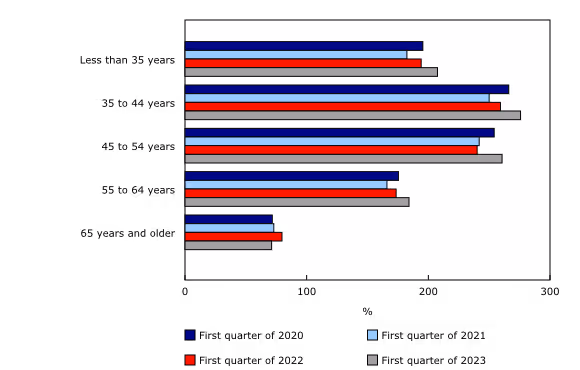
Since RetireBetter has an interest in the state of affairs for Canadians over the age of 55, we wanted to look more closely at the long-term and short-term trends for these older household groups. Over a 10 year period, we can see the following trends for debt-to-income ratio levels for Canadian households relying primarily on pension income:

We can see debt levels for Canadian pensioners was relatively constant from 2013 to 2019 when it ranged around 75%. The debt-to-income level for this group fell to 72% at the early stages of the pandemic and reached a high point of 89% in the spring of 2022. Since then, it has been dropping and as of the end of Q1 2023, the debt level for Canadian pensioners is now 83.3%. Despite this recent drop in debt levels, the current debt-to-income levels for Canadian pensioner households remains well over its long-term levels.
Can Reverse Mortgages Help Pensioners?
In this challenging economic landscape, reverse mortgages can provide a lifeline for older homeowners who are dealing with higher costs of living and higher interest rates.
For those aged 55 and older, reverse mortgages allow homeowners to tap into the equity in their primary residence (determined after a home appraisal), providing a source of income that can help manage expenses (such as credit cards or lines of credit) and maintain a standard of living during tough economic times.
To learn more about reverse mortgages in Canada, you should read:
To find out how much you could get from a reverse mortgage, you can also try our reverse mortgage calculator.
Looking Ahead
As we navigate these turbulent economic waters, it's crucial for older adults to consider all available financial tools. Reverse mortgages can be a valuable part of this toolkit, providing financial stability in uncertain times. At RetireBetter, we're committed to helping you understand your options and make informed decisions about your financial future.
FAQ
Q1. What is a debt-to-income ratio?
A. A debt-to-income ratio is a measurement of financial health. The ratio shows how much debt someone owes in comparison to their annual income. If someone has a 50% debt-to-income ratio, it means they owe 50 cents for every $1 they earn.
Q2. What is a reverse mortgage? How does a reverse mortgage work?
A2. A reverse mortgage is a loan available to any homeowner over the age of 55. It does not require a minimum payment to be made every month and does need to be repaid until the borrower dies. There is no minimum credit score or gross monthly income requirement for a reverse mortgage.
Q3. How does Statistics Canada measure the cost of living?
A3. Statistics Canada uses the Consumer Price Index (CPI) to measure the cost of living. The CPI tracks the average cost of typical household goods and services over time. If this basket of goods costs more, then the CPI also increases and so has the cost of living.


